Grafana for the Support Team
Overview
Grafana is a monitoring and visualization tool that connects to data sources. It displays backend logs and performance metrics, such as CPU usage and response times. We can use it to diagnose issues, analyze system health and review backend logs. It also provides alerting to quickly address performance bottlenecks.
Grafana Access
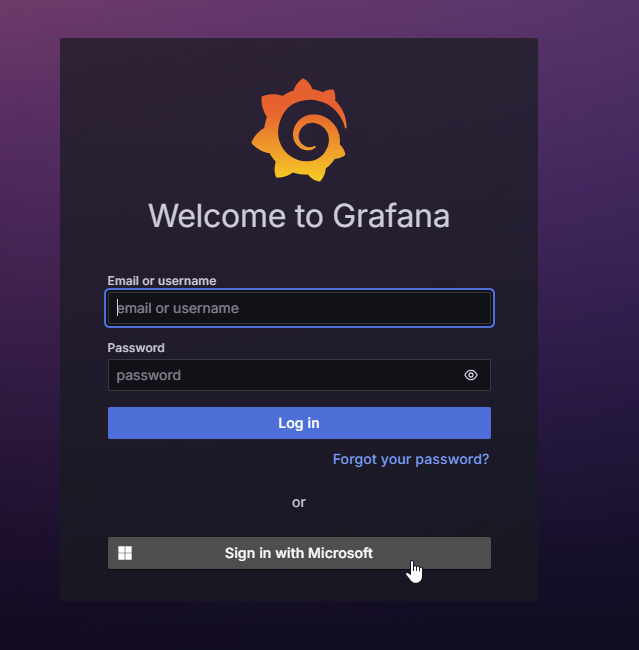
We can log in using the “Sing in with Microsoft” button.
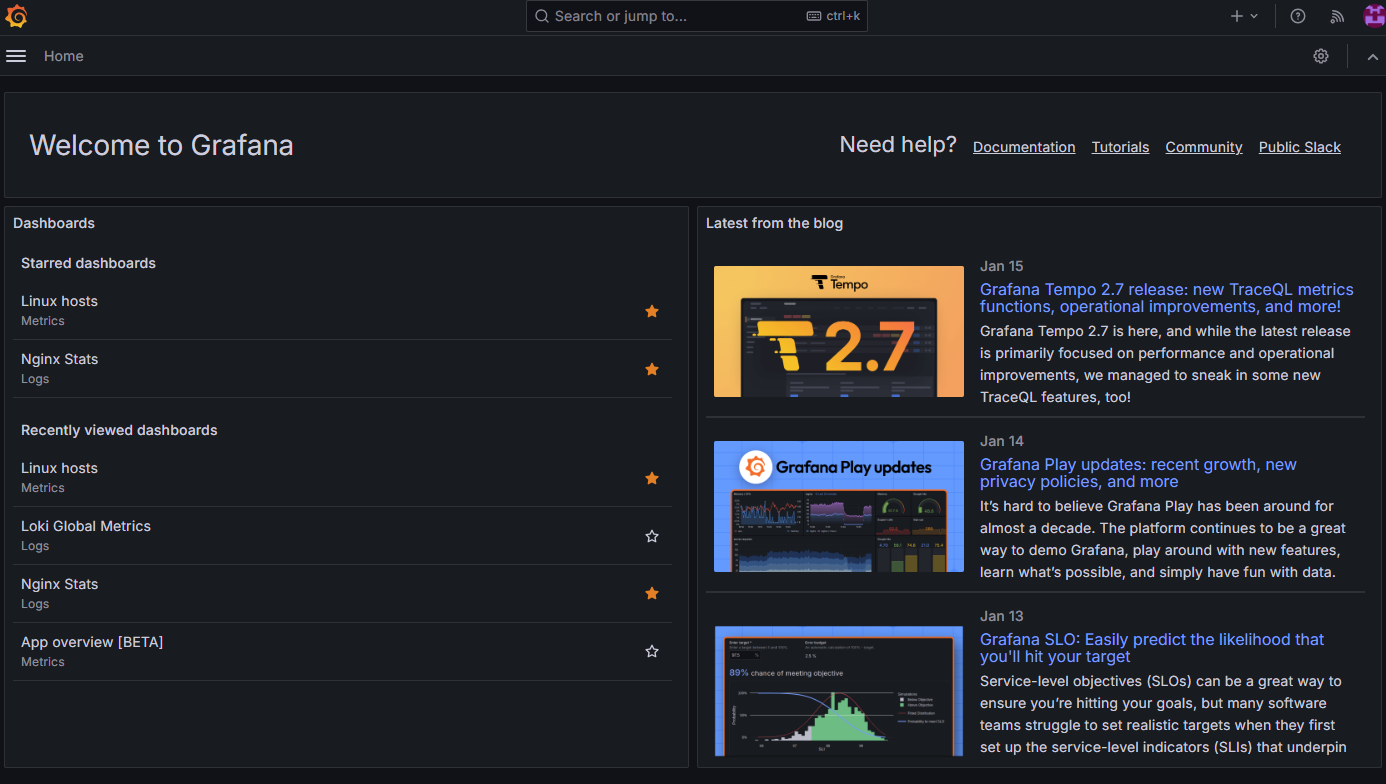
Grafana Home page
Once you open the Grafana site it should display the window shown below. From this view, you can navigate through the various options in the menu located to the left of the "Home" label.
To verify the Instance Status.
This Instance Status page in Grafana provides a real-time snapshot of the health and performance of both the application server and the SQL database server, and the status of Cognos and the application server.
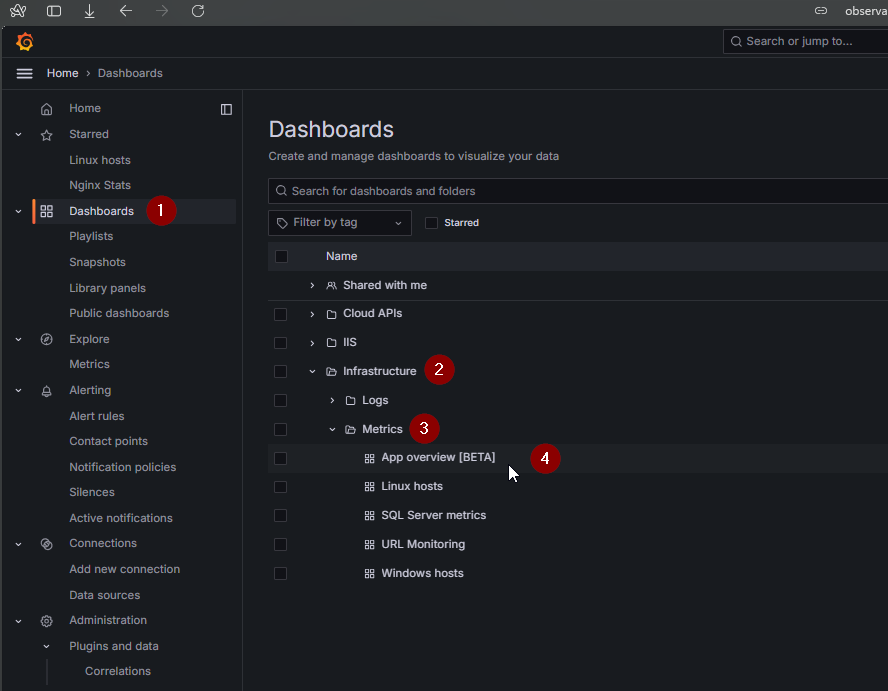
Server is up and running.
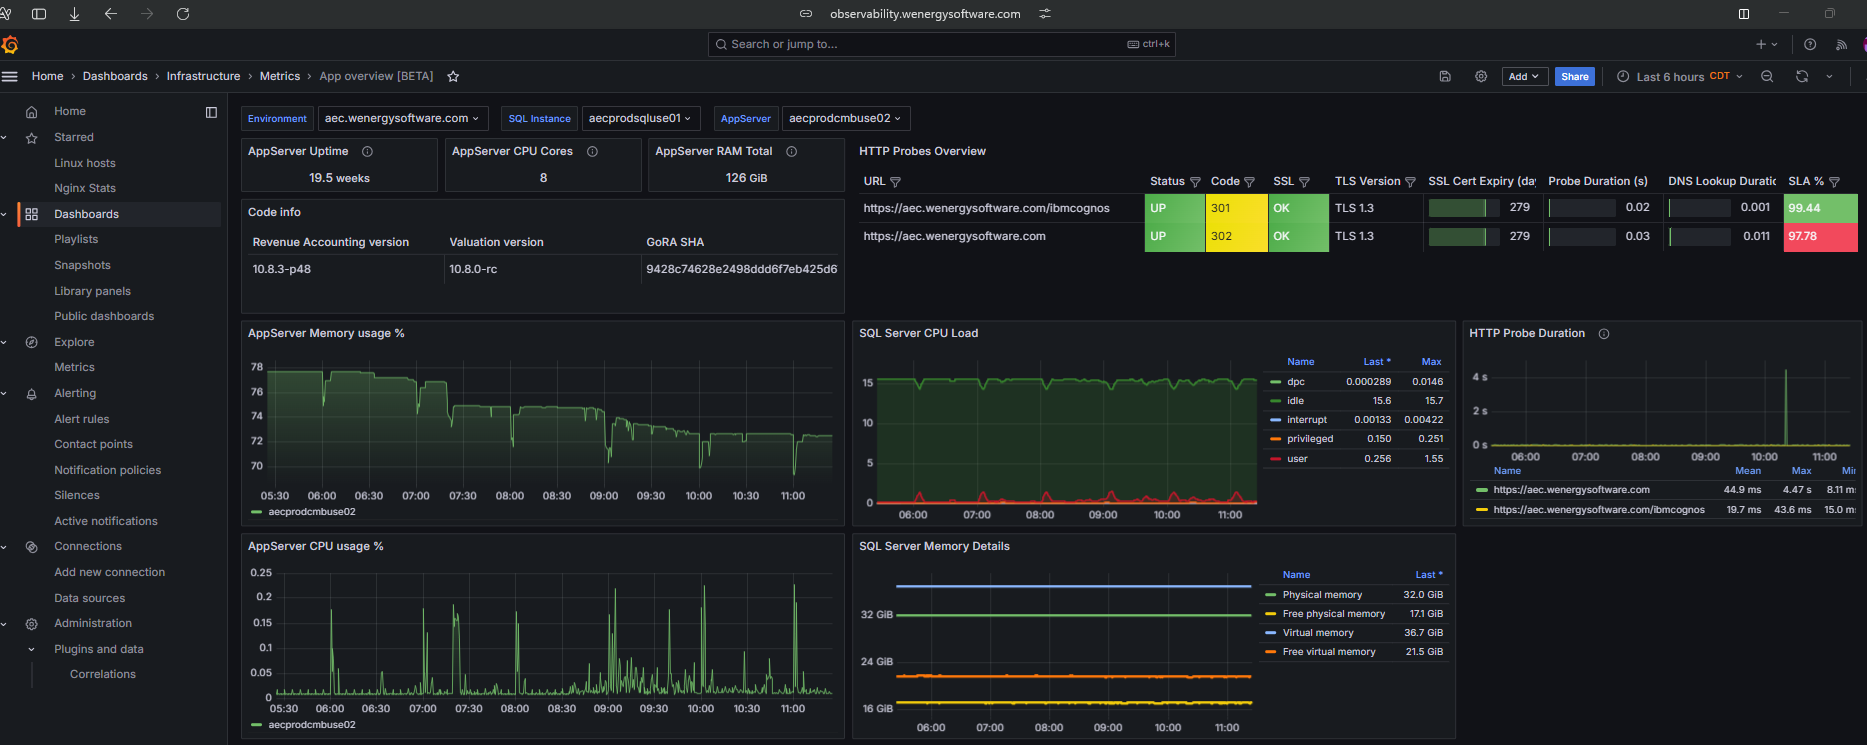
Servers are down, returning 500 or 502 errors.
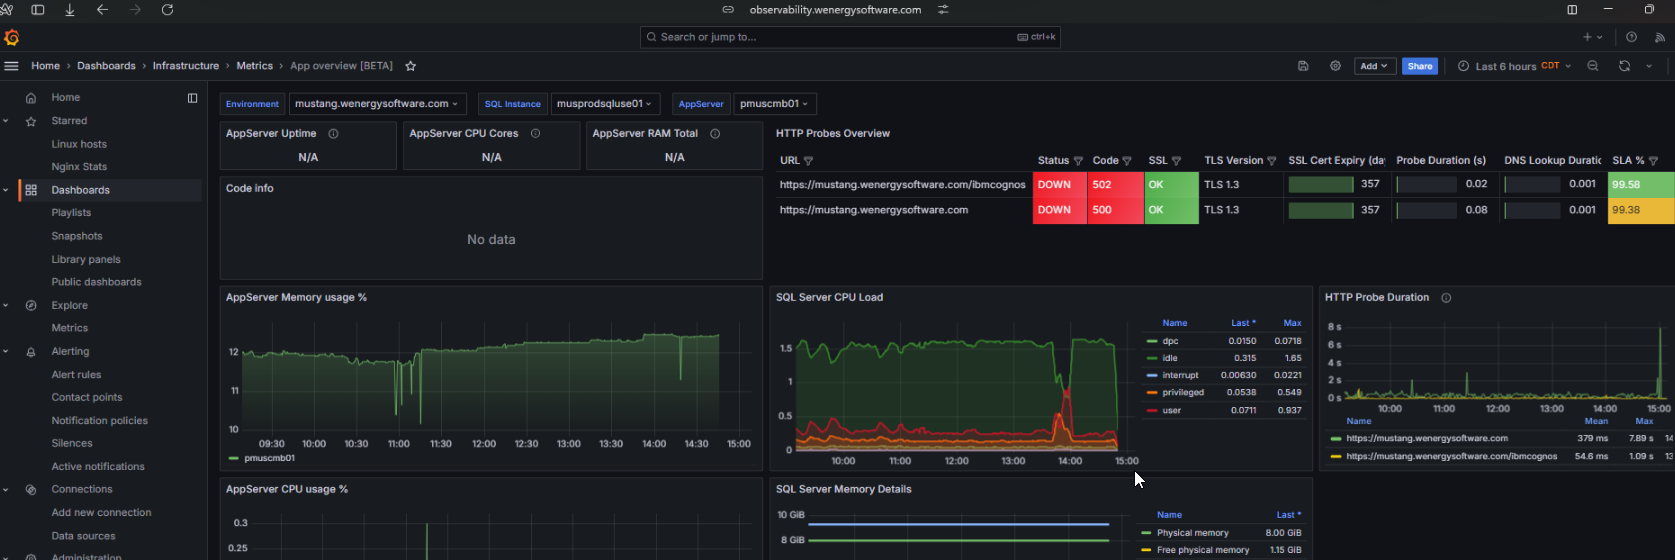
To verify CPU Usage - Instance Health
Click on the menu icon and select the option, “Dashboards”.
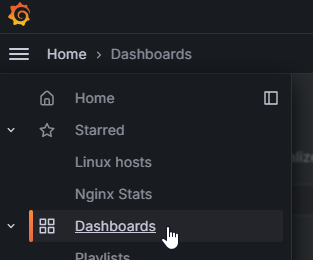
After clicking on Dashboards, look for the “Linux Hosts” option.
Infrastructure >> Metrics >> Linux Host.
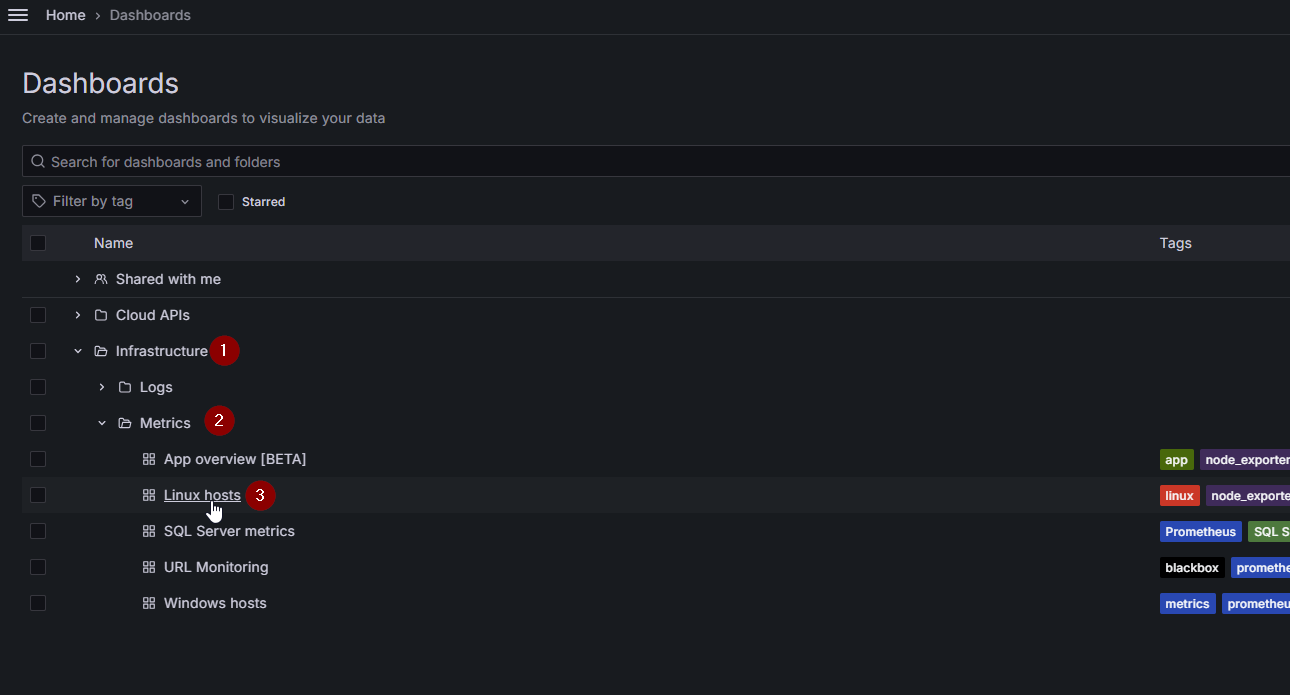
Grafana will display a window with all graphs available for monitoring. We only need to set up the “Job” and the “Host”.
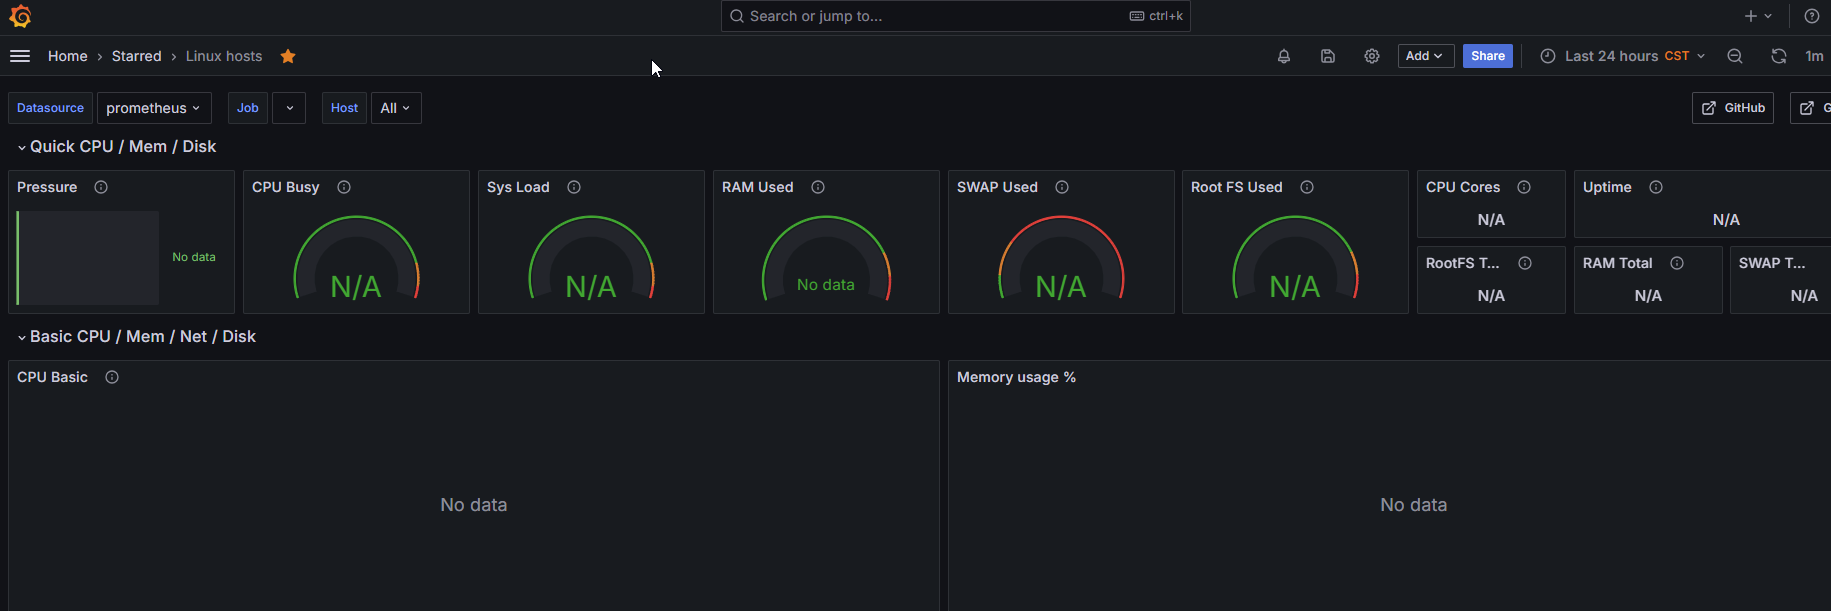
Fields to configure to display the instance performance:


The "Job" field typically represents a label that identifies the source of the metrics being collected. It is used to group or distinguish metrics based on the specific service, process, or system component being monitored. For example, it might indicate a server name, application, or a specific monitoring task configured in the data source
the "Host" field is used to filter metrics based on the specific server, machine, or instance being monitored. It allows you to narrow down the data displayed to a particular host within the selected "Job," providing more granular insights into system performance for that specific machine.
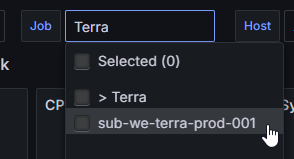
In W, the “Job” name refers to:
In Azure: The Subscription
In OpenMetal: Only OpenMetal
In AWS: The Account
E.g. Terra Job would be:
The “Host” refers to the instance where the PROD/UAT/TEST/Project data is housed.

You can confirm the “Host” at https://wemanage.wenergysoftware.com/#/hosts. To confirm, simply check the Host Name displayed through the corresponding icon  of the environment that you want to monitor.
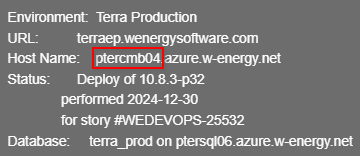
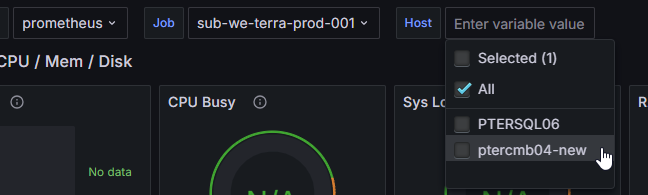
E.g.
The Production Hosts usually start with a “p”
Once all the fields are configured, you should see all the monitoring metrics, such as CPU basics, Memory Usage %, Network Traffic basics, and more.
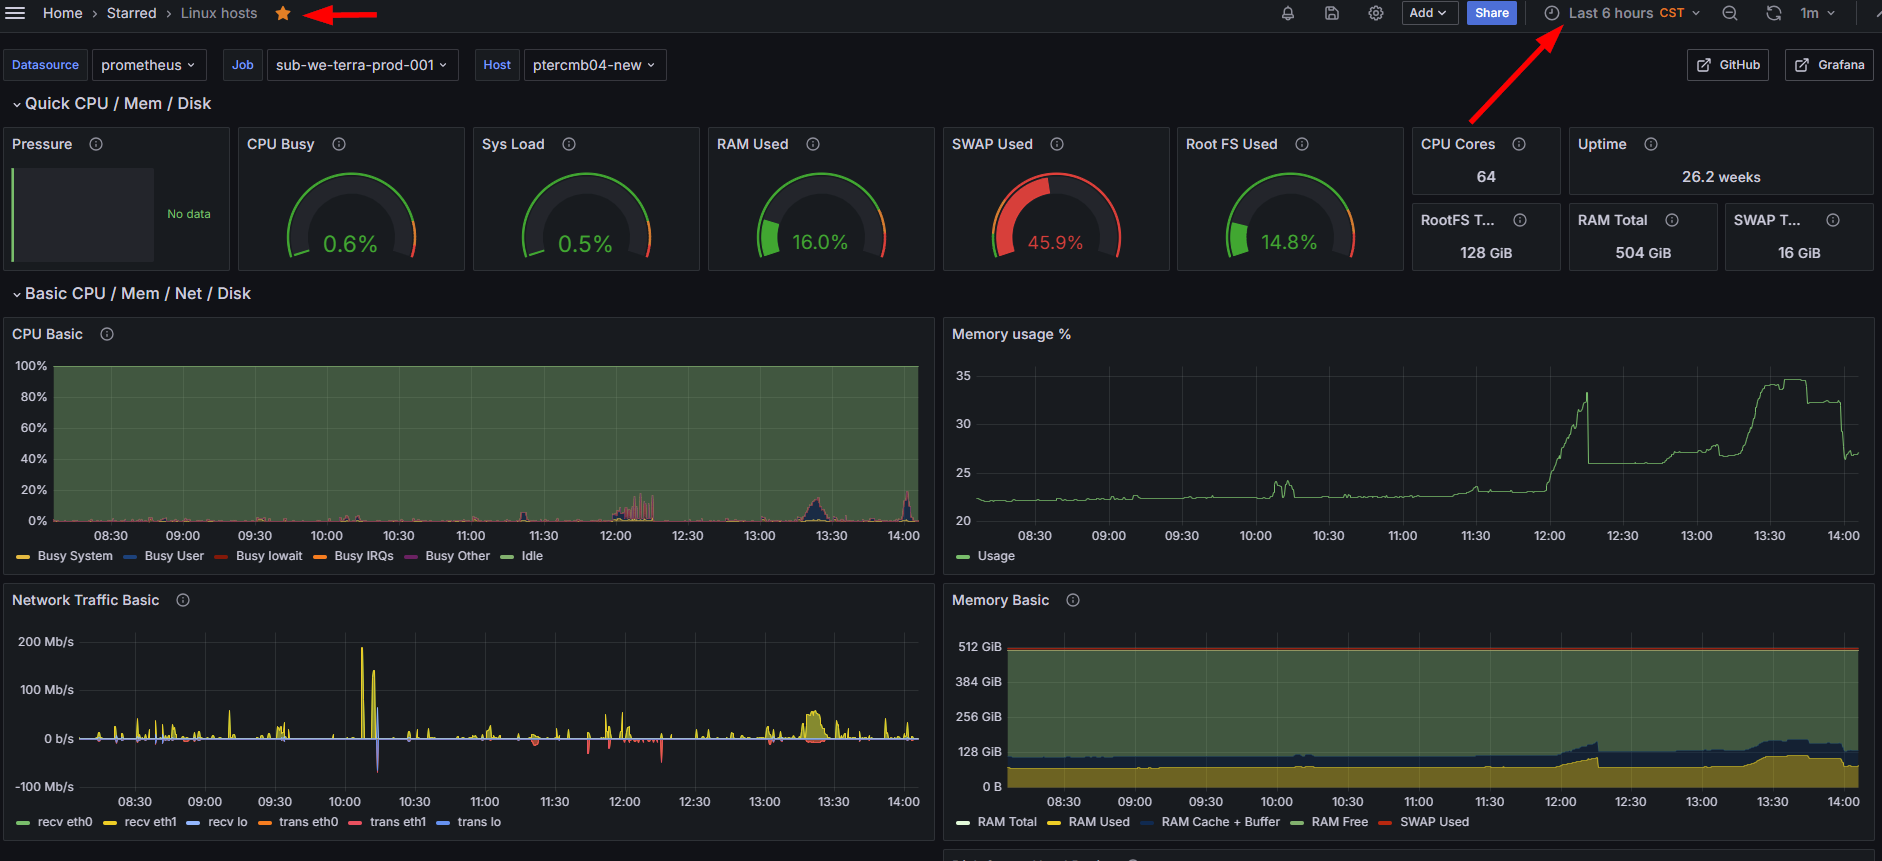
In the window above, you can star this dashboard for quick access and adjust the monitoring timeframe as needed.
To verify Backend - Instance Logs
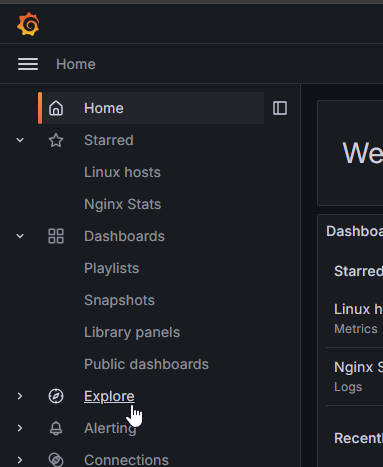
Click on the menu icon and select the option, “Explore”.
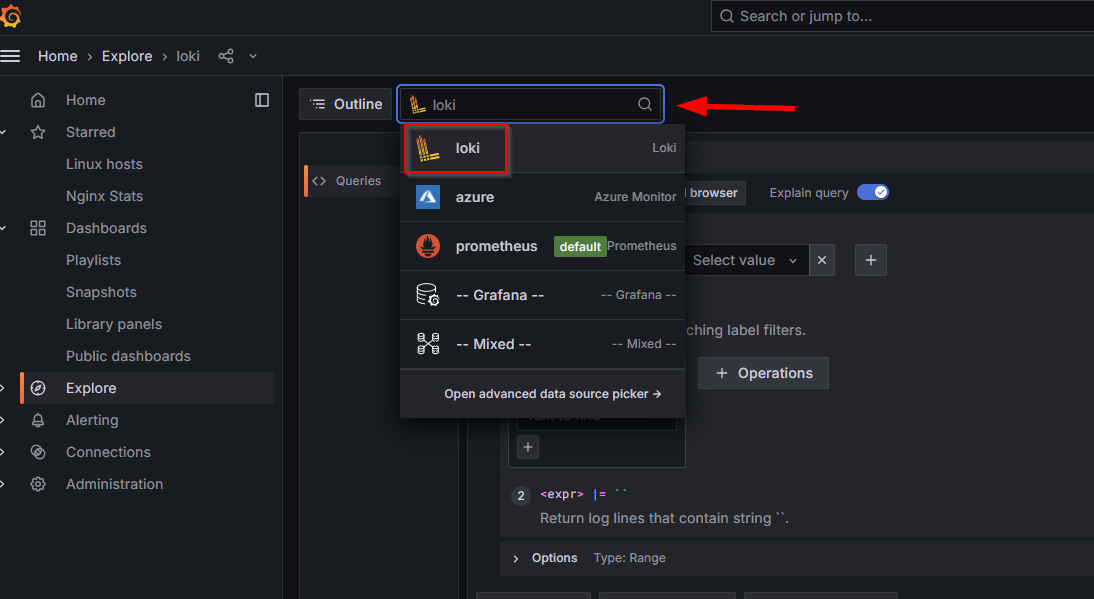
Once in the explore window, search for “loki” as data source.
Set the filters for the query as shown below.
1- Select the filter, in this case, “Instance_name” which is the same “Host name”, you can copy and paste it in the filter.
2- Select the timeframe as needed.
3- Include the string or word that you want to seek in the logs. For example: “Error”
4- Verify what the logs will return.
5- Run the query.
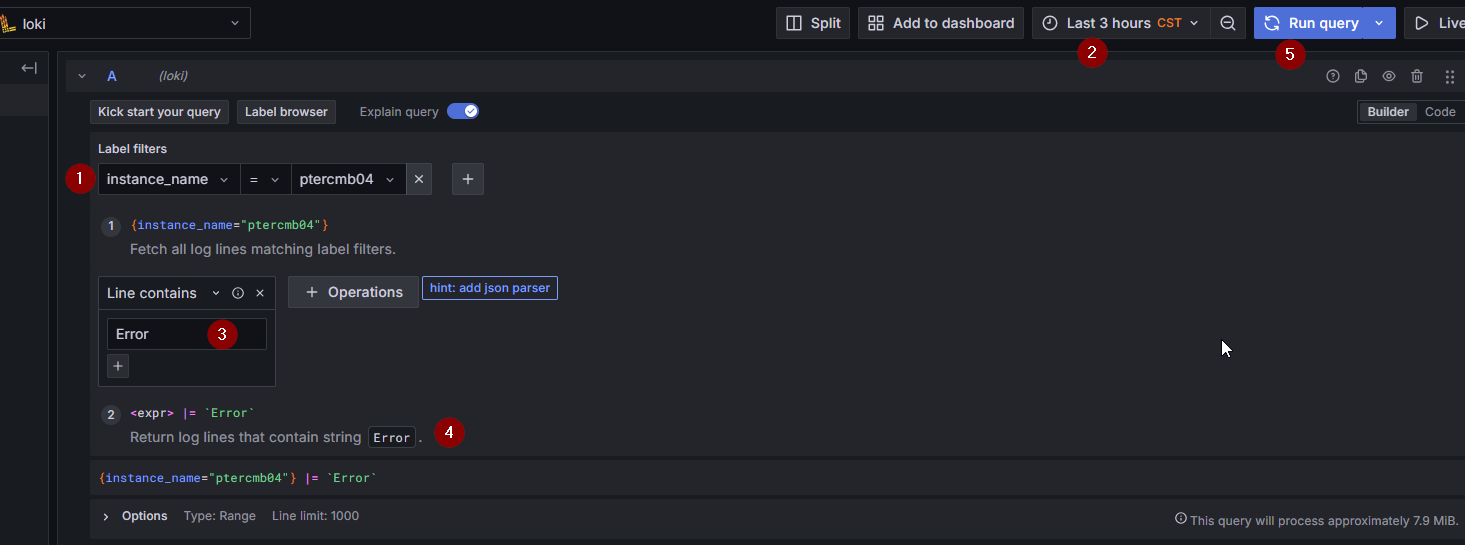
You can adjust the filters according to your needs, and in the “options” you can increase the number of lines to get from the query, it’s by default 1000 but you can increase it up to 5000.
Once you run the query, Grafana will return the Logs lines that include the word “Error”.
In the below window, you will find a lot of information that can help you with your research.
For example:
The timeframe of occurrence.
line options as “Wrap Lines” or Prettify JSON responses.
Download the logs returned.
The word “Error” highlighted in every line.
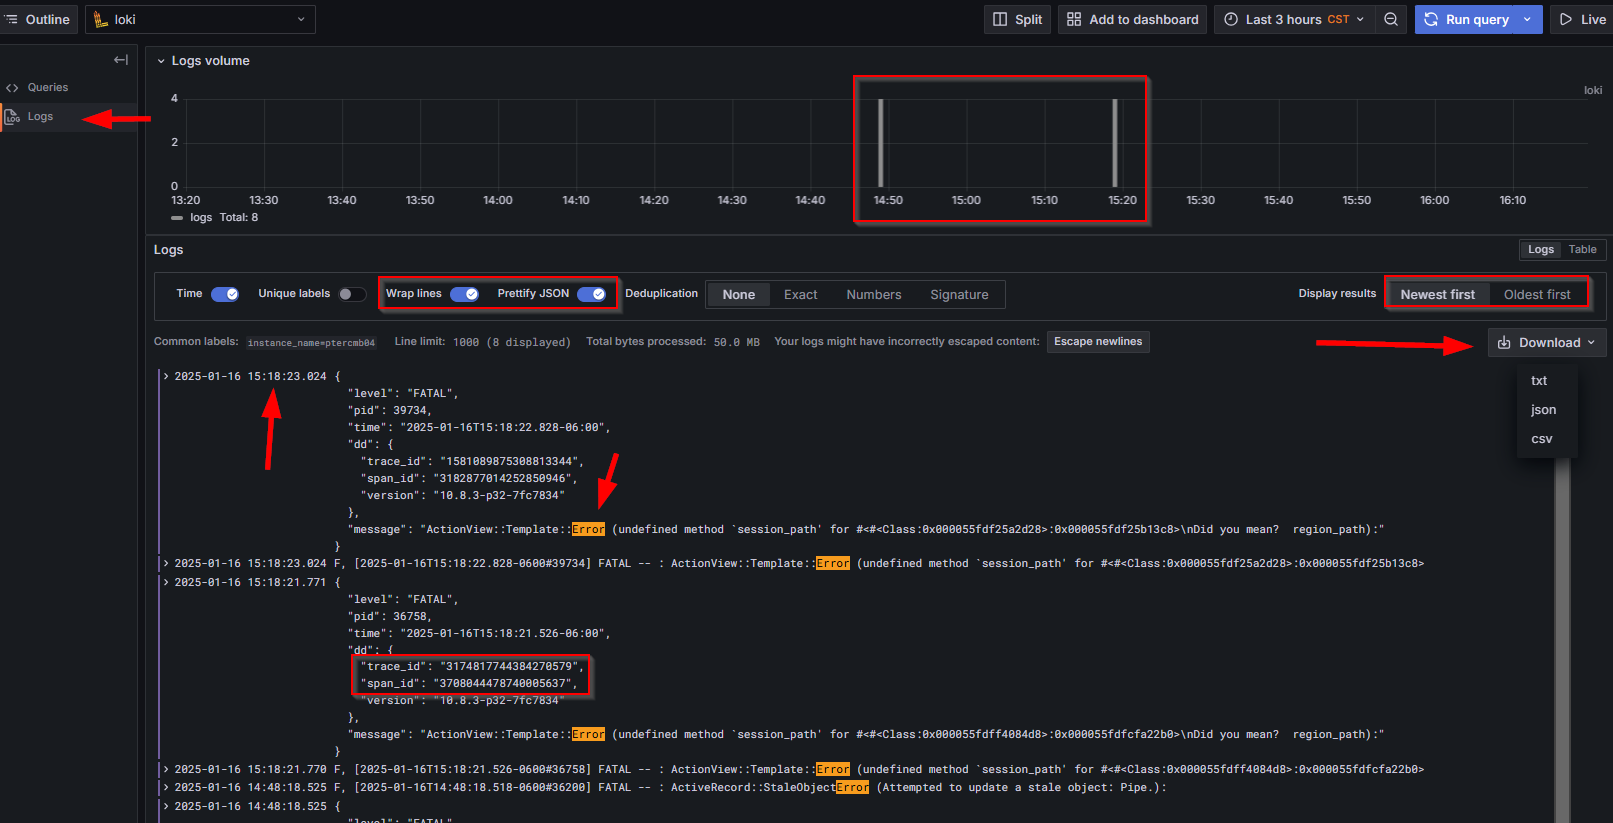
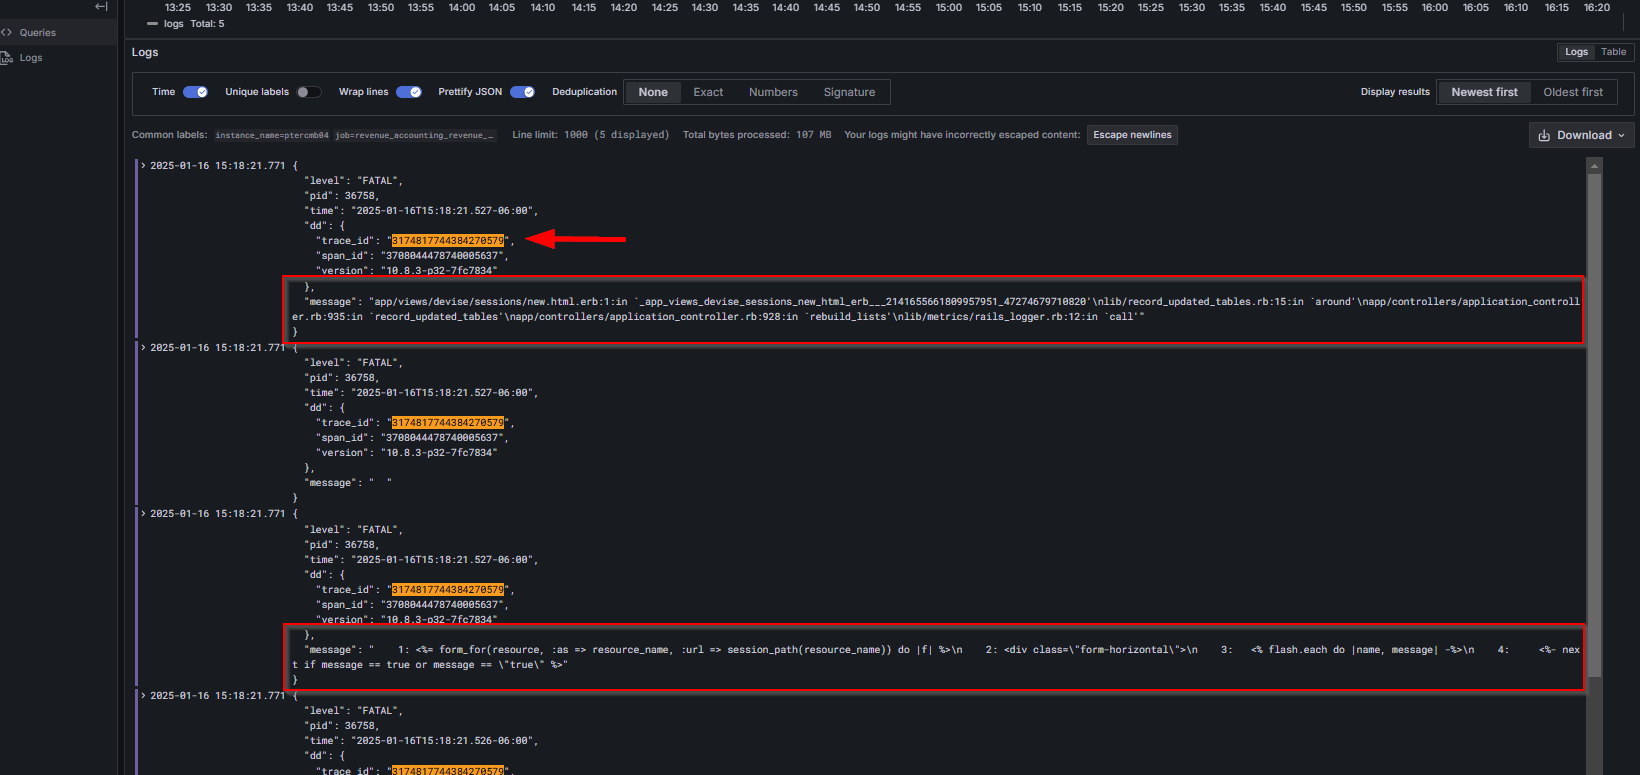
Some lines will provide you with a Trace ID or Span ID, which are identifiers for specific errors or occurrences. These IDs can be copied into the 'Text to find' filter to retrieve additional errors related to the same occurrence or event. Please refer to the example below
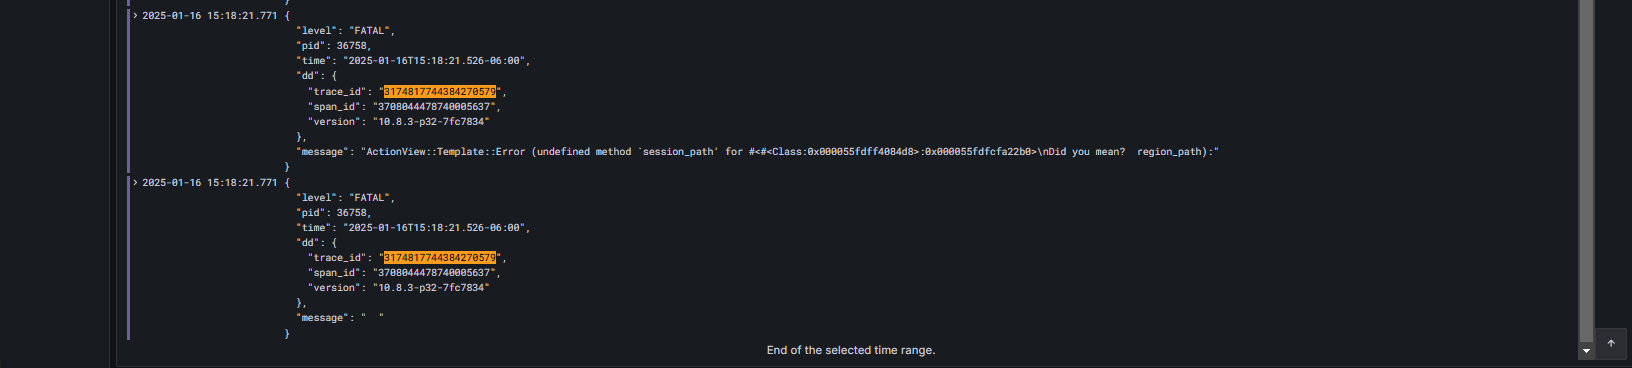
Once you get the line or error that you are looking for, you can use the “trace_id” or “span_id” of that line to get more logs for the same error or event. For the example below, we copied and pasted the “trace_id” above and executed the query again.
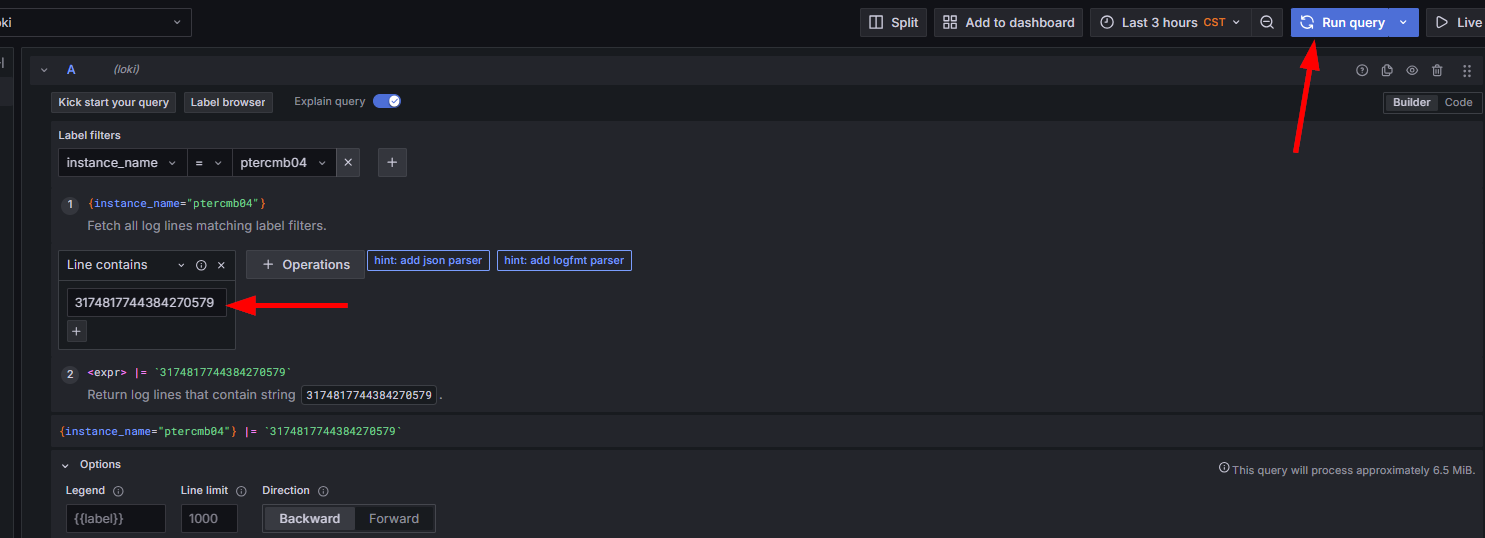
By following this process, you can retrieve all logs related to the specific 'trace_id,' providing more valuable backend information about the identified error.